

")
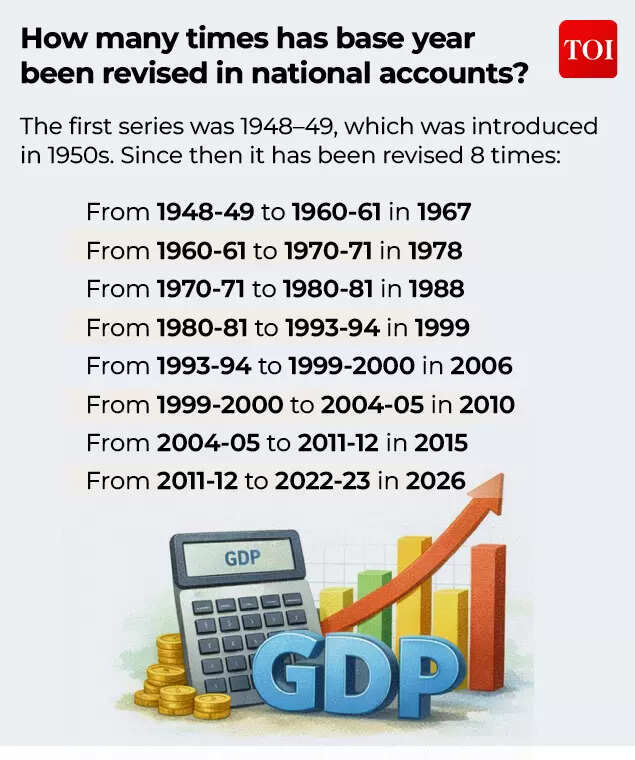
India has retained its tag of the world’s fastest growing major economy in the third quarter of the financial year 2025-2026, with a better-than-expected GDP growth of 7.8%. This is despite the third quarter being the first full three months of Donald Trump administration’s 50% tariffs. Aiming for a more accurate picture of economic growth, the first GDP data for India under a new series has been released on Friday. The growth projections for the full year 2025-26 have been revised upwards to 7.6%.Several methodological improvements have been made in the way GDP is calculated. For one, the base year for calculations has been revised from 2011-12 to 2022-23. Other changes involve changing the relative weights of output sectors and demand segments, better coverage by the use of additional and more disaggregated data including GST data and by better methods of scaling up economic activities of the informal sector and companies. Incidentally, last year IMF had rated India’s national accounts data in a ‘C’ category, highlighting outdated base year.What does the GDP data tell you about the Indian economy? When will India become the third largest economy? What’s changed in the new GDP series and why is it important? We take a look:
Decoding GDP data: What does it tell you about the health of India’s economy?
The first GDP data under the new series presents a picture of largely broad-based growth. Experts are of the view that the series is in line with the older one in terms of divergence in GDP and GVA growth estimates.Sujan Hajra, Chief Economist & Executive Director, Anand Rathi Group says, “India’s Q3 FY26 GDP and FY26 Second Advance Estimates exceeded 7.5%, marginally above expectations, with trends broadly consistent across the new and old series. Nominal growth remains below 9%, but manufacturing and services momentum is reassuring.” “On the demand side, both private consumption and investment grew over 7%, indicating balanced expansion. The stronger-than-expected data support an improved outlook for corporate earnings and enhance fiscal prospects, underpinning both equity and debt market sentiment,” he tells TOI.Ranen Banerjee. Partner and Leader, Economic Advisory Services Government Sector Leader, PwC India notes that the manufacturing sector printed strong. “This was expected given the GST boost in Q3 that was reflected in high frequency indicators. The services sector has also printed strong given it was a quarter of festivities with the year end travel boosting the travel and hotels component,” he told TOI.“Agriculture has printed softer but it is likely owing to the double deflation method adopted for output and input and other methodological changes. We would need to watch the next quarter release of the Agricultural sector data to understand how much of the softness is owing to methodological changes,” he said.Experts also believe that the new methodology will help address concerns raised by the IMF on India’s GDP data.DK Srivastava, Chief Policy Advisor, EY India says that the methodology changes would improve India’s rating of the NSO data from category ‘C’ to a better category in terms of the IMF framework of assessing the reliability of a country’s national income statistics.Ranen Banerjee of PwC India explains that the new GDP series methodology is more aligned to global SNA methodology. “An important change is that it will now relatively be dynamic as far as the informal sector is concerned as it will use the Annual Survey of Unincorporated Enterprises data. Another important change is use of the GST data for the Net Tax impact in the computation of the GVA. The double deflation method will also help in better estimation of the value added by industry as the outputs and inputs would be deflated separately,” he said.“The quarterly numbers would also be more comparable over the years when the annual data is revised in subsequent releases of the GDP as the Proportional Denton method will smoothen the quarterly data revisions as it will be based on some of the high frequency data points for the relevant quarter. There are several other improvements that have been made that will enhance the confidence on the estimates of growth and will make it more aligned to international standards,” he adds.
The Road To Becoming the 4th Largest Economy
The GDP growth estimates paint a strong growth story for India – which is also the fastest growing major economy in the world. IMF estimates at the start of 2025 projected that India would overtake Japan to become the fourth largest economy by the end of FY 2025-26. However, the rupee’s depreciation seems to have played spoil sport.
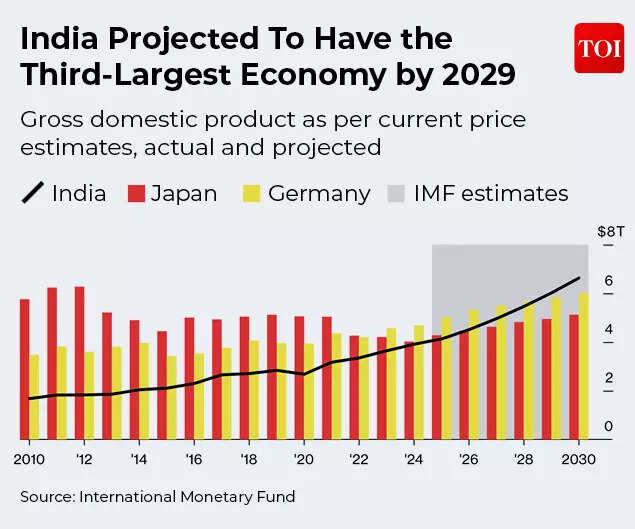
Chief Economic Adviser V. Anantha Nageswaran estimates that India will become a $4 trillion economy in the next financial year, growing at 7-7.4% in FY 2026-27.“We are on course to becoming the top three or the top four largest economies in the world. There is no doubt about that. It will happen in the course of the next few years. Our growth rate post covid has been probably one of the best if not the best in the world, especially among G20 economies. In India’s case, the exchange rate did not go in our favor in 2025-26. That will naturally have an impact. So the timing, given global uncertainty, given what happens to exchange rates, and the growth rates in other countries could be variable,” he said.
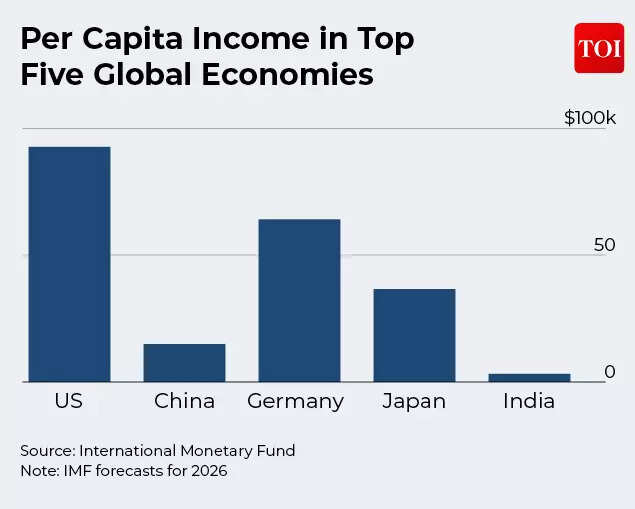
While India is on the road to being among the top 3 economies in the world, its per capita income is very low compared to the other top 5 global economies. China, which is the world’s second largest economy also has a much lower per capita income compared to the US, Germany and Japan.
Why is base year and its revision important?
To put it simply, the base year acts as a reference year. It is for this year that the prices are used to calculate any change in the real growth of an economy. Over a period of time, a base year becomes outdated as price levels rise. To present a more accurate picture of an economy’s real GDP growth, the revision of the base year is important.Hence, the base year is updated by the government periodically to reflect the changes that have happened in the economy over the years. The aim is to ensure a more accurate method to calculate major economic indicators.
According to MoSPI, the methodology and data sources that are used in the compilation of GDP and other macro-economic indicators for a particular series are finalized when the base year is being revised. MoSPI has said that the revised GDP data series is in line with the international statistical standards.
What’s new in the series?
“Under the revised base year (2022–23), the quarterly GDP estimation framework has been strengthened through important methodological improvements, most notably the shift from the earlier Pro-Rata benchmarking method to the Proportional Denton method,” says MoSPI.“The new benchmarking method will remove artificial discontinuities, commonly known as the “step problem,” and ensure smoother and more consistent quarterly series that better reflect underlying short-term movements in economic activity,” it adds.While several new data will now be made part of the GDP calculation, the top 5 that stand out are:GST: Data from GST will now be made use of for allocation of all-India estimates with regard to the private corporate sector. This holds across states. The GDT data will also help in cross-validation in annual accounts. The data also finds extensive use in quaternization and as an indicator in Quarterly National Accounts, MoSPI has said.Household Sector Measurement: Regular annual surveys will not be used to understand and assess the growth rates for the household sector. Earlier, the rates were calculated between surveys or through proxy indicators. The surveys that will now be used are Periodic Labour Force Survey (PLFS), and Annual Survey of Unincorporated Sector Enterprise (ASUSE). GST data will be used to cross-check the assessments of interpretations drawn from these surveys.e-Vahan data: Private Final Consumption Expenditure or PFCE that is related to spending on road transport services will now be assessed using e-Vahan data. Public Finance Management System (PFMS): This will be used to look at central government estimates and allocate them accordingly among states. According to MoSPI, this step will allow for the use of actual expenditure data instead of revised estimates.Studies: MoSPI has said that new and updated rates and ratios will be used that will be based on recent studies conducted by expert institutions. These rates include:
- Study on transport services by JNU for PFCE
- Study on milk and related products by the National Dairy Research Institute for PFCE
- For agriculture, grass and fodder study by the Indian Grassland and Fodder Research Institute
- Fisheries studies by Central Marine Fisheries Research Institute and the Central Inland Fisheries Research Institute
Interestingly, the government has moved to capture the contribution of gig workers, and even hired domestic workers such as drivers and cooks. Such activities have been termed as ‘activities of households as employers of domestic personnel’. Their contribution is being included in the estimation of the GDP. The estimation for this data based on the number of such workers and their wages, that is available from the annual PLFS data.
How does the methodology change?
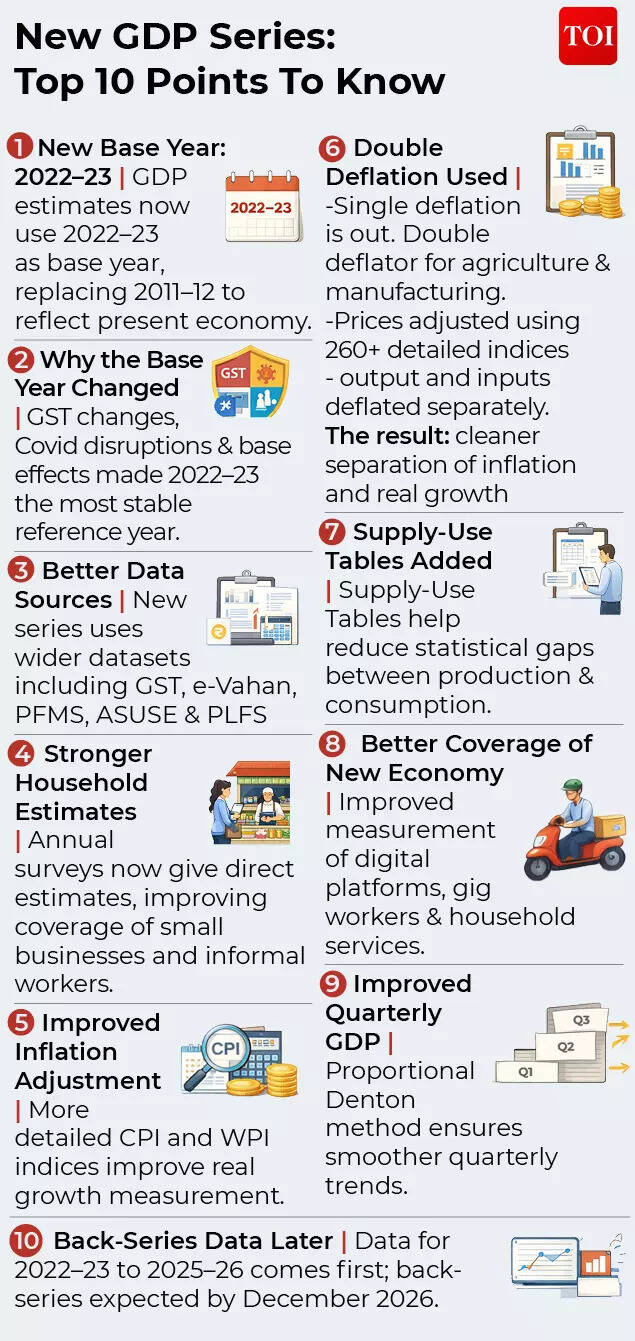
According to MoSPI, there are seven major changes in the GDP calculation methodology under the new series:Double deflation: The new GDP series replaces single deflation with a more refined method. Agriculture and manufacturing now use double deflation, while other sectors rely on single extrapolation.Prices are adjusted at a far more detailed level – using over 260 granular CPI indices and item-level WPI in manufacturing. By deflating output and inputs separately, the method better isolates real growth from price changes, improving the accuracy of GVA estimates.Rates and ratios have been updated: Many of the ratios and rates that are used when compiling data are being revised from surveys that have now become available in the intervening period. Studies conducted by expert organisations are also being used by MoSPI.Measurement of household sector: As explained above, ASUSE and PLFS will be used for a more accurate data compilation.Supply and Use Tables: This framework is being integrated with the National Accounts framework. MoSPI aims to reduce, to the maximum extent possible, the discrepancy that can be there between GDP from production and expenditure approaches. Supply and Use Tables show what industries produce – that is supply – and how products are used by industries or final consumers – the use. A balanced Supply and Use Table will see that the total supply matches total demand in the economy. New data sources: As explained above, new sources of data such as GST data, PFMS, e-Vahan that are not only more comprehensive, but also available at a shorter time lag will augment existing data sources.Multi-activity private corporations and their segregation: This is an important one, since treatment of entities as individual and whole will change. As per MoSPI, in the earlier series, the total value added of multi-activity enterprises was allocated to the major activity of the enterprise.However, as per the new GDP series, MGT-7/7A data has become available. Under this corporations are mandated to report activity-wise share in their turnover. Now this will be used to segregate total value added (and other aggregates) across different activities. Estimation of PFCE: According to MoSPI, the new series uses a mixed approach; enhanced use of the Household Consumer Expenditure Survey; direct estimation based on production and other data sources; the commodity flow approach.